Dashboard
When you first log in to the Sitekit CMS administration system you will be presented with the Dashboard.
The Dashboard shows:
- My recent edits, a list of your recent page edits. This box contains additional options to view Site activity and all Unpublished pages.
- Site size, how many files, images, page, files, folders, and the hard drive space they use.
- Site bandwidth, how much bandwidth is being used (how much data is being downloaded from your website).
- Emails sent (11.3), how many emails the site is sending, e.g. notification emails, enquiry form auto-responses, mailshots.
- Today's top broken links, highlights broken links on the site.
- This month's most popular Pages, Downloads, Search terms.
Top Downloads and Top Search Terms Reports
These two reports allow you to inspect the top File Downloads and Search terms for a given month.
When you first select one of these reports, you will be shown a listing of Downloads or Searches for the current month. If you wish to view the results for an earlier month, just select the Month and click the Update button (pictured below). This will update the report, displaying statistics for the selected month.
If you wish to export the data, just click the export button. The data will be exported as a csv file, and a new Excel spread sheet will be automatically created and populated with the data.

Note that the Top Downloads report runs off a rolling year's worth of data. The Top Search Terms report, however, only contains a rolling 60 days of data. So if you try to view data from three months back, you'll get a blank report. If you wish to record Searches permanently, use the Export option once every one or two months.
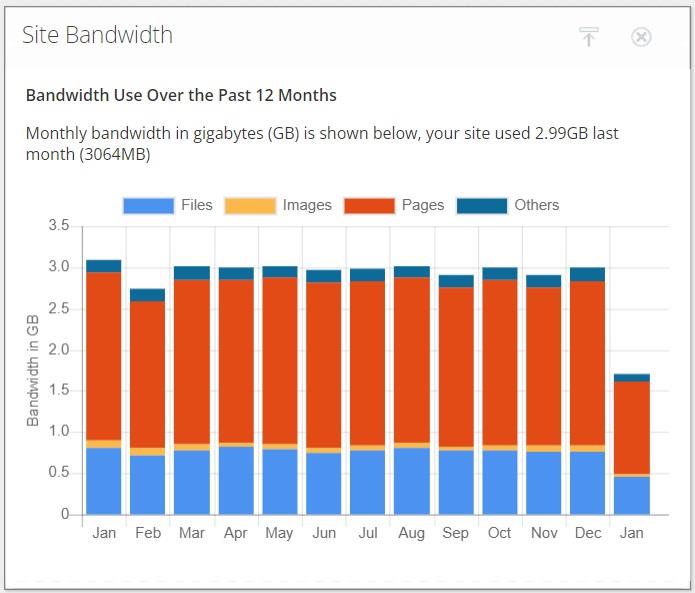
Site Bandwidth Graph
This chart shows a rolling-one year display of monthly download figures for your site, measured in megabytes and broken down into separate figures for pages, images, files and 'others'.
A typical Site Bandwidth Graph is shown below.