Storage report
The storage report outline what asset are taking up what space in your site, It then flags up some areas that could be looked at to reduce your storage and costs.
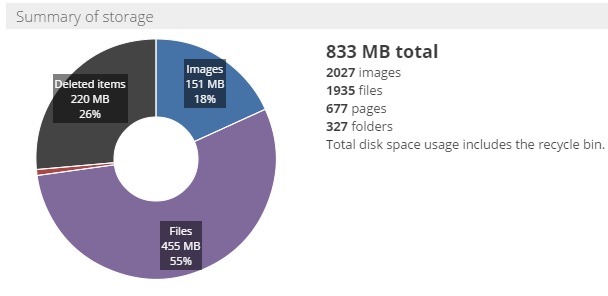
The initial pie chart is the same as is on the desktop but it also displays the proportional volume in Mbytes of each segment. So in the example below, the 2027 Images on this site make up 26 percent of the total , taking up 220 Mbytes .
The report is then broken down into
- Unused assets
- Largest files
- Multiple version
Dealing with each in turn
Unused assets
The unused data listings are based on comparing what assets have been requested by site visitors and administrators and comparing that to the assets currently available on the site. Some of the numbers could refer to assets that are still needed but that have just never been visited so its worth looking at the unused assets list below to see if unexpected content is there, it could be that its hidden from navigation or not indexed by Google.
The section starts with a summary of which volumes have never been used in Files, images and pages and then provides a table in order of oldest request, assets that have never been requested are labelled as such. The table has a popup to provide more details from this table, apply filtering and CSV export for external reporting.
Largest files
Even with modern infrastructure, hosting and serving large files is not a good idea. Your users might be trying to download them over a phone on GPRS. This table gives a list of the 5 largest files on your site.
Multiple versions
Every time a files is updated in Sitekit the previous version is preserved. Over time the volume of such files can be become large. This report provide a lsit of the top 5 files with most version held by the site. You can save storage by deleting older version of such files.